This mobile app usage statistics report show how people use smartphones in daily life. Apps now dominate mobile activity, replacing mobile web browsing for most routine tasks.
Instead of spreading attention across many services, users spend most of their mobile time on a small number of frequently used apps.
This listicle roundup is based on data collected from trusted and widely cited sources, including peer-reviewed research papers, long-term academic datasets, industry reports, and global market studies. Every statistic in this guide is supported by verified research, and all source URLs are clearly listed at the end for full transparency and reference.
Key Mobile App Usage Statistics
Mobile app usage statistics show how apps dominate smartphone activity and shape daily digital behavior. Across academic studies, long-term datasets, and usage analyses, apps account for the majority of mobile engagement, replacing web browsing for most routine interactions.
These statistics highlight time spent, frequency of use, installation volume, and long-term behavioral change, setting a factual baseline for understanding how deeply apps are embedded in everyday life.
- People spend over 3 hours per day on mobile phones, with approximately 90% of total mobile phone time spent using mobile apps rather than mobile web, based on long-term mobile usage analysis.
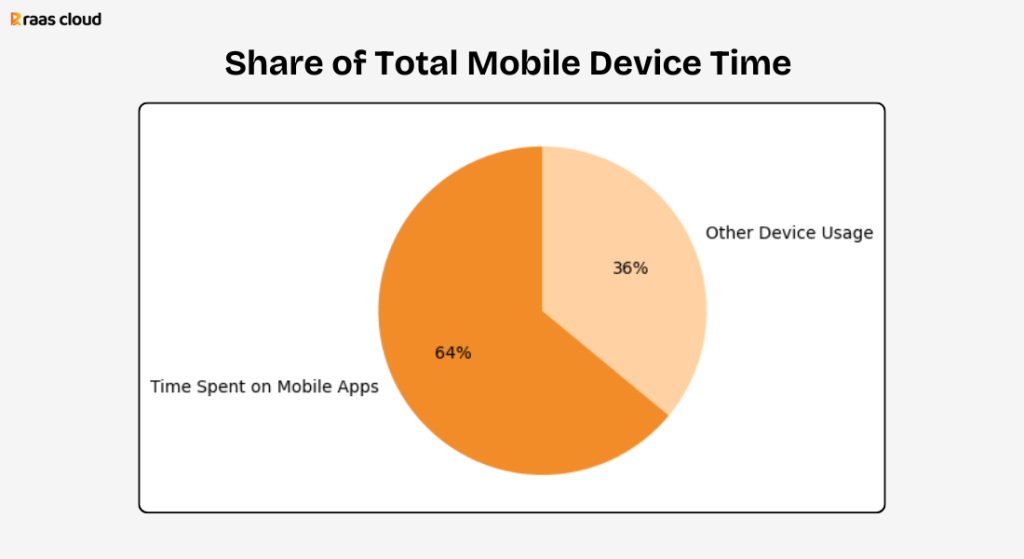
- Around 64% of total mobile device time is spent on mobile apps, showing that app-based activity outweighs all other forms of mobile usage.
- Long-term dataset analysis of 1,608 users across more than 40 countries shows that 60% to 70% of users change their app usage patterns over periods longer than 3 years, indicating that app behavior evolves significantly over time.
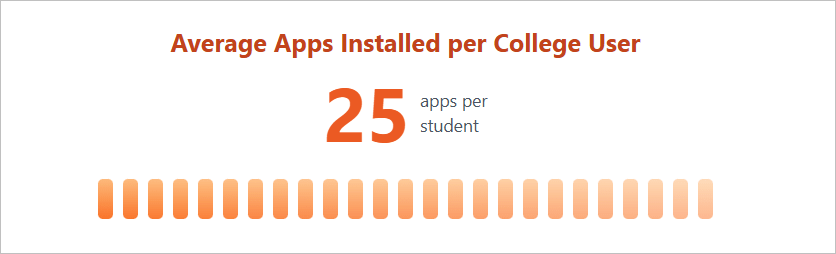
- College-aged smartphone users install an average of approximately 25 apps on their devices, reflecting high app adoption even within a limited demographic group.
- The same student usage study shows that users open their primary app an average of 6 times per day, demonstrating repeated daily engagement with a small set of core apps.
- Social media apps are identified as the most frequently used app category among college students, ranking higher than utility, travel, and other functional app categories.
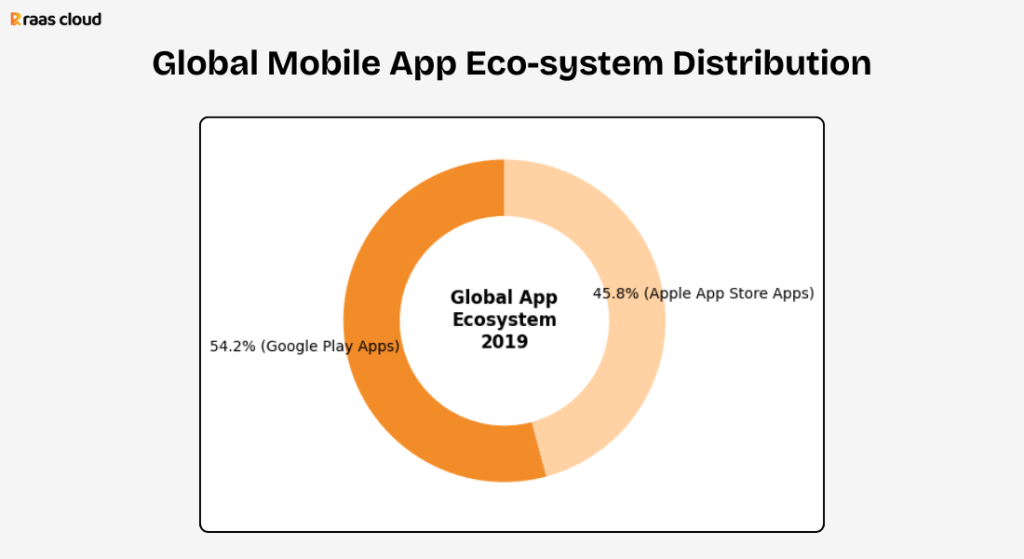
- Global app market data shows that users could choose from approximately 2.6 million Android apps and 2.2 million iOS apps as of early 2019, illustrating the scale of available app ecosystems users engage with.
- Total app usage increased by approximately 50% globally between 2016 and 2018, reaching an estimated 1,350 billion total hours of app usage worldwide.
- Social apps account for about 50% of total app usage time globally, making them the single largest driver of mobile app engagement.
Growth of Mobile App Usage Over Time
Mobile app usage has not remained static. Long-term studies and market-level data show clear growth in both time spent and overall engagement, alongside measurable shifts in how users interact with apps as their lives and circumstances change. Rather than locking into fixed habits, users adapt their app behavior over the years, reflecting changes in demographics, routines, and digital dependence across different stages of life.
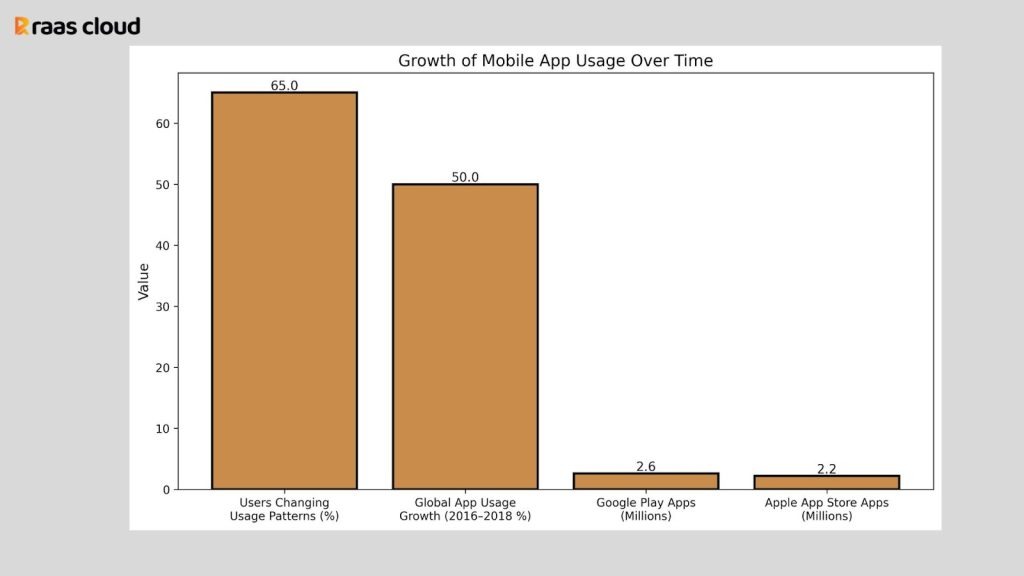
- Long-term analysis of 1,608 users with more than 3 years of tracked data shows that between 60% and 70% of users change their app usage patterns over time, confirming that mobile app behavior evolves rather than remaining consistent.
- Global mobile app usage increased by approximately 50% between 2016 and 2018, reaching an estimated total of around 1,350 billion hours of app usage worldwide, highlighting rapid growth in overall engagement.
- App ecosystem expansion has accompanied usage growth, with available apps increasing to approximately 2.6 million on Google Play and 2.2 million on the Apple App Store by early 2019, supporting wider adoption and diversification of use.
- Long-term behavioral studies show that changes in app usage patterns often align with shifts in users’ socioeconomic attributes, including employment status, income level, family size, and civil status.
Mobile App Usage by Demographics and Socioeconomic Factors
Mobile app usage shows measurable differences across demographic and socioeconomic groups when observed over long time periods. Large-scale longitudinal datasets make it possible to link app usage patterns with attributes such as age, income, education, household structure, and employment status.
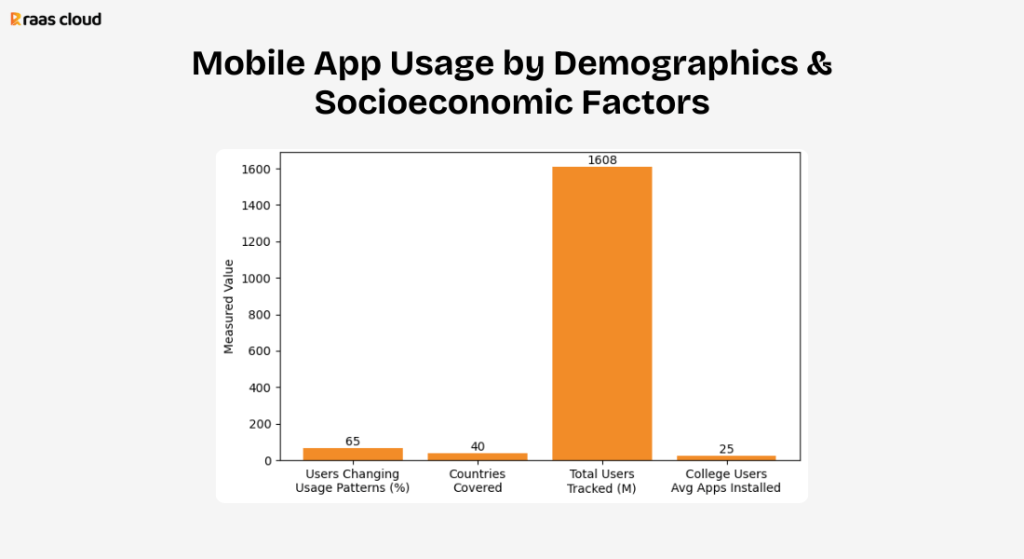
- A long-term dataset tracking 1,608 users across more than 40 countries over periods exceeding 3 years confirms a persistent relationship between app usage behavior and users’ socioeconomic attributes.
- Demographic survey data collected from 3,303 app users includes measurable attributes such as age, gender, education level, occupation, income, savings, debt, household size, and civil status, enabling statistically grounded comparisons of app usage across user groups.
- Long-term usage analysis shows that 60% to 70% of users change their category-level app usage patterns over multi-year periods, while demographic correlations with usage remain stable despite these changes.
- Usage pattern transitions are linked to measurable life changes, with app behavior shifting alongside documented changes in employment status, income level, household size, and civil status observed over 3+ years of continuous tracking.
- College-aged users surveyed in a sample of 395 students show consistent demographic-specific behavior, including an average of 25 installed apps per user and repeated daily engagement with a limited set of core apps.
Time Spent on Mobile Apps and Daily Usage Frequency
Time-based usage data shows how mobile apps dominate daily smartphone activity, not just in total hours but in how frequently users return to the same apps throughout the day. Studies across different datasets consistently report high daily engagement levels, repeated app openings, and a strong concentration of time within a small number of app categories.
- Long-term mobile usage research shows that people spend over 3 hours per day on mobile phones, with approximately 90% of that time spent using mobile apps rather than mobile web services.
- Usage analysis finds that 64% of total mobile device time is spent on mobile apps, confirming that apps account for the majority of daily smartphone interaction.
- College student usage data collected from 395 respondents shows that users open their primary app an average of 6 times per day, highlighting repeated daily engagement with the same application.
- Global app usage data estimates total annual app engagement at approximately 1,350 billion hours, following a 50% increase in total app usage between 2016 and 2018.
- Category-level usage data shows that social apps account for approximately 50% of total app usage time, making them the most time-intensive app category globally.
Mobile App Categories and Usage Concentration
Mobile app usage is not evenly distributed across categories. Data shows that a small number of app types account for a disproportionate share of total engagement, with users concentrating time and attention on a limited set of functions. Category-level statistics help explain which types of apps dominate daily behavior and how usage clusters around communication, entertainment, and core services rather than spreading evenly across all installed apps.
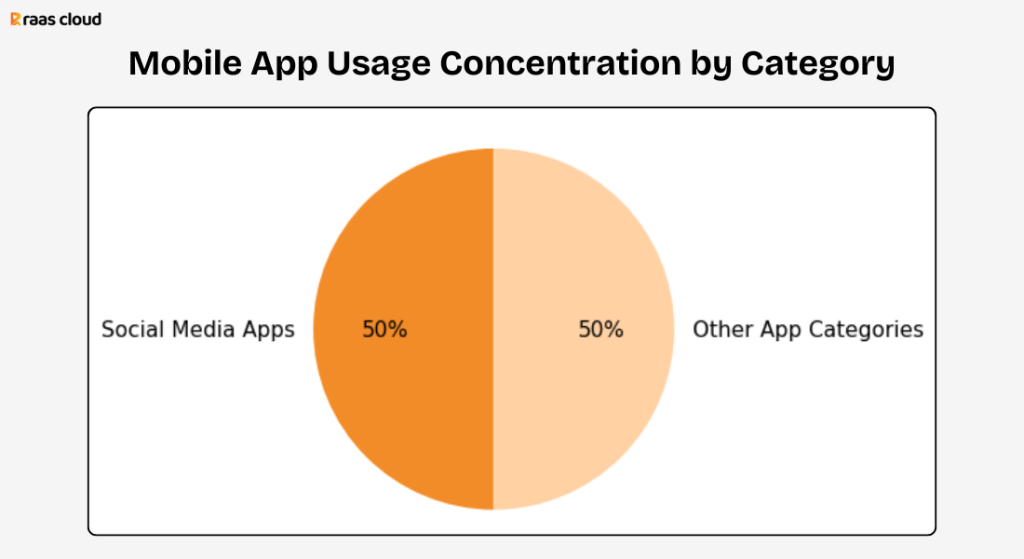
- Social media apps account for approximately 50% of total app usage time globally, making them the most dominant category in terms of sustained user attention.
- Usage data shows that total global app engagement reached approximately 1,350 billion hours, with a significant share driven by a small number of high-frequency app categories rather than broad category diversity.
- Studies of college-aged users indicate that while individuals install an average of 25 apps, usage is concentrated on a much smaller subset, with social media identified as the most frequently used category.
- App ecosystem data shows that users could choose from approximately 2.6 million Android apps and 2.2 million iOS apps, yet usage patterns remain highly concentrated despite the large volume of available apps.
- Long-term app usage analysis across 1,608 users shows that category-level preferences shift over time for 60% to 70% of users, but dominant categories continue to absorb most daily usage even as specific apps change.
Mobile App Adoption, Installation, and Market Scale
Mobile app usage is shaped not only by how long people spend in apps, but by the sheer scale of app adoption and availability. Installation data and market size figures provide context for why usage is increasingly concentrated, competitive, and selective. Despite millions of available apps, user behavior shows clear limits in how many apps are installed, retained, and actively used over time.
- As of early 2019, users could choose from approximately 2.6 million apps on Google Play and 2.2 million apps on the Apple App Store, reflecting the scale of the global mobile app ecosystem.
- Total global app downloads reached 194 billion in 2018, up from 178 billion in 2017, showing continued growth in app adoption year over year.
- In 2018, approximately 105.3 billion app downloads were made through the Google Play Store and Apple App Store combined, with 76 billion downloads from Google Play and 30 billion downloads from the App Store.
- College-aged smartphone users surveyed in a sample of 395 students report installing an average of 25 apps on their devices, despite having access to millions of available options.
- Market-level usage data shows that, despite high download volumes, long-term behavior analysis finds that 60% to 70% of users change their app usage patterns over multi-year periods, indicating churn and replacement within installed app sets.
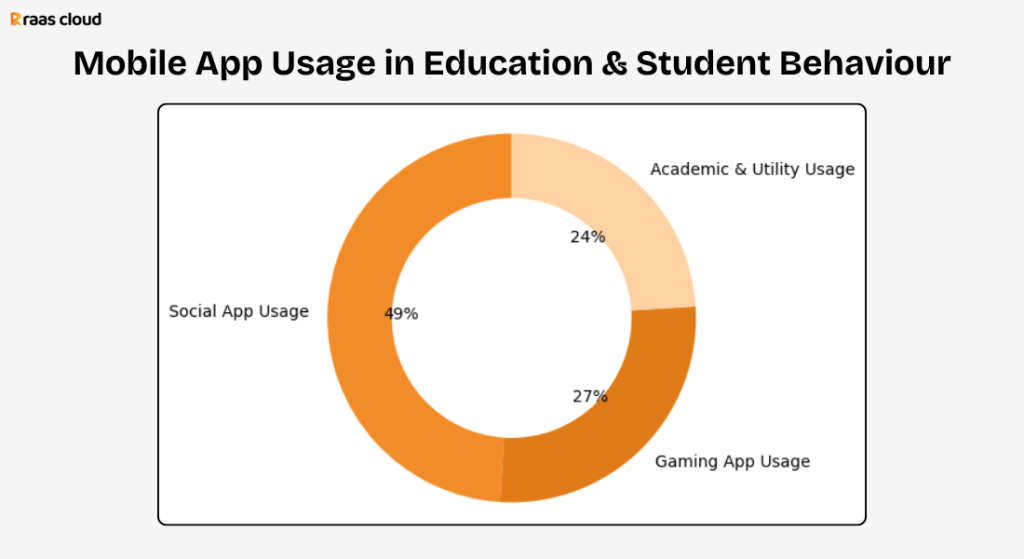
Mobile App Usage in Education and Student Behavior
Mobile app usage plays a measurable role in how students communicate, learn, and manage academic tasks. Survey-based studies of college students provide concrete data on ownership, frequency of use, and in-class behavior.
- A survey of 395 college students across 2 academic institutions found that 99.8% of college students own a cellphone, with smartphones identified as the primary device used for apps and messaging.
- The same study reports that 80% of students admit to texting at least once during class, highlighting frequent in-class mobile app usage alongside academic activities.
- Research shows that 97% of smartphone users in the student population use mobile apps for social networking purposes, making social apps the most commonly accessed category.
- College students are reported to open their primary app an average of 6 times per day, demonstrating repeated engagement with the same app throughout daily routines.
- Gaming app usage is also significant, with 55% of students reporting that they use gaming apps either regularly or as a leisure activity on their smartphones.
Mobile App Usage and Consumer Behavior
Mobile app usage data shows a clear link between app adoption and consumer behavior, particularly in shopping, information search, and transaction-related activity. Studies focused on mobile commerce and consumer-facing apps quantify how frequently users rely on apps to discover products, compare options, and complete purchases.
- More than 2 billion mobile device users globally complete some form of mobile commerce transaction, showing that app usage is directly tied to purchasing behavior.
- Approximately 95% of mobile internet users report using their devices to look up local information for the purpose of calling or visiting a business, demonstrating how apps support location-based consumer decisions.
- In Poland, 46% of smartphone users accessed mobile apps in 2014, with usage expected to increase by an additional 14% the following year, reflecting rapid growth in consumer-facing app adoption.
- Studies report that consumer usage of mobile apps increased by over 100% within a few years, driven largely by shopping, promotion, and information-seeking behavior.
- Consumer research shows that users typically keep an average of 17 installed apps, but only 8 apps are actively used within 30 days, indicating selective engagement despite broad installation.
Long-Term Changes in Mobile App Usage Behavior
Long-term datasets make it possible to move beyond short snapshots of app usage and examine how behavior evolves across years. Unlike short surveys, multi-year tracking reveals measurable shifts in category preferences, usage intensity, and stability. The data shows that while users may maintain consistent habits for periods of time, most experience meaningful changes in how they use mobile apps as life circumstances change.
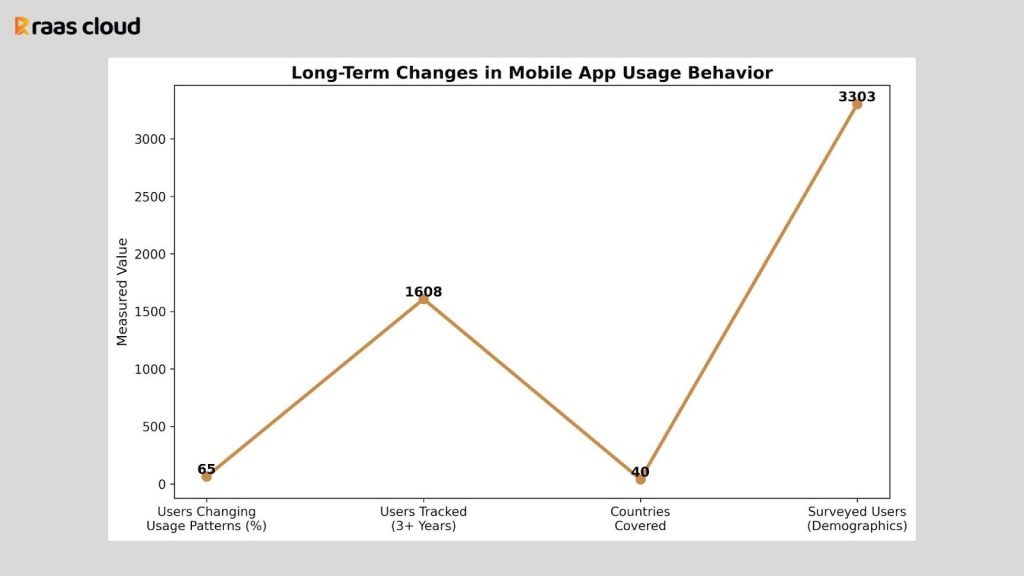
- A longitudinal study tracking 1,608 users over periods exceeding 3 years shows that between 60% and 70% of users change their app usage patterns over time, confirming that long-term behavior is not static.
- The same dataset covers users from more than 40 countries, allowing observation of usage changes across diverse geographic and socioeconomic contexts.
- Demographic data linked to long-term usage includes detailed attributes from 3,303 surveyed users, enabling direct comparison of app behavior before and after life changes such as employment or income transitions.
- Category-level usage changes observed over 3+ years align with documented changes in socioeconomic status rather than short-term experimentation or random variation in app use.
Final Words: What Mobile App Usage Statistics Show
Mobile app usage statistics point to a clear shift in how people interact with digital services on smartphones. Usage is concentrated, repetitive, and deeply tied to daily routines, with most mobile time spent inside a small number of apps rather than spread across the broader app ecosystem. Long-term data confirms that while users install many apps, sustained engagement remains limited and selective.
The data also shows that mobile app behavior is not fixed. Over multi-year periods, a majority of users change how they use apps, with these shifts closely linked to measurable demographic and socioeconomic changes. Taken together, the statistics show that mobile apps are not just tools of convenience but evolving digital touchpoints shaped by time, context, and life circumstances.
Data Sources
- https://doi.org/10.48009/4_iis_2016_8-20
- https://doi.org/10.1007/s42486-020-00041-3
- http://hdl.handle.net/10138/333795
- https://www.businessofapps.com/data/app-statistics/
- https://doi.org/10.21008/j.0239-9415.2019.080.18
- https://www.nielsen.com
- https://www.statista.com
- https://www.ericsson.com/en/reports-and-papers
- https://doi.org/10.4018/978-1-4666-8239-9.ch100
- https://doi.org/10.1109/COMST.2022.3163176
FAQs
1. How much time do people actually spend using mobile apps each day?
Long-term mobile usage research shows that people spend over 3 hours per day on mobile phones, and approximately 90% of that time is spent using mobile apps rather than the mobile web. This confirms that apps, not browsers, account for the majority of daily mobile engagement.
Do users keep the same app usage habits over time?
No. Longitudinal analysis tracking 1,608 users over more than 3 years shows that 60% to 70% of users change their app usage patterns over time. While behavior may remain stable for certain periods, most users experience meaningful shifts in how they use apps across years.
How many apps do users typically install compared to how many they use?
Student-focused surveys show that users install an average of 25 apps on their smartphones, but usage is concentrated on a much smaller subset. Consumer studies also report that users keep around 17 installed apps, with only 8 used actively within 30 days.
Which mobile app categories dominate overall usage time?
Category-level usage data shows that social media apps account for approximately 50% of total app usage time globally. This makes social apps the most time-intensive category, far exceeding utilities, travel, or productivity apps.
How often do users open the same mobile apps each day?
Usage studies of college students show that users open their primary app an average of 6 times per day. This indicates that daily app usage is highly repetitive and focused on a limited number of core apps.
Does mobile app usage differ across demographic groups?
Yes. Long-term datasets combining app usage and demographic surveys from 3,303 users show a stable relationship between app usage behavior and attributes such as age, income, occupation, household size, and civil status, even as individual app choices change over time.
Are mobile apps mainly used for entertainment, or do they affect real-world behavior?
Mobile app usage is closely tied to real-world actions. Data shows that more than 2 billion mobile users complete some form of mobile commerce transaction, and 95% of mobile internet users use apps or mobile services to look up local information for calling or visiting businesses.

Dhanalakshmi Kadirvelu is a Business Intelligence and Data Analytics expert with a strong focus on software development and data engineering. She creates efficient data models, builds interactive dashboards, and integrates analytics into software systems using Power BI, OBIEE, and SQL. Her work helps development teams use data effectively to create smarter software solutions and improve business performance.