Android and iPhone continue to share the global smartphone market. While Android leads worldwide in overall share, iOS holds strong positions in key premium markets like the United States. The gap becomes even more interesting when we look at revenue, user spending, loyalty, and demographics.
The article presents all the latest and historical statistics on global market share and helps businesses, founders, and product teams understand how both platforms differ in reach, revenue potential, and user profile.
All statistics in this article are collected from reliable industry reports and research publications. The complete list of source links is provided at the end of the article for reference.
Key iPhone vs Android Market Share Statistics
- Android holds 70%+ of the global smartphone market, while iOS controls about 29%.
- In the U.S., iOS leads with nearly 60% market share.
- India is 95% Android, making it one of the most Android-heavy markets globally.
- iOS generates over 65% of global app revenue despite having fewer users.
- iPhone App Store spending is projected to hit $161B by 2026, more than double Google Play.
- 68% of U.S. adults aged 18–29 use an iPhone.
- Over 90% of iPhone users stick with iPhone when upgrading.
- iPhone users spend about $101 per month on tech, nearly twice that of Android users.
- Android serves up to 4.5 billion users worldwide; iOS reaches up to 1.8 billion.
Need help in designing and developing your next mobile app? Explore our services at RAAS Cloud 👇
What Is the Current Global Mobile OS Market Share Worldwide?
1. Android Holds 70.36% of the Global Mobile OS Market While iOS Accounts for 29.25% as of January 2026
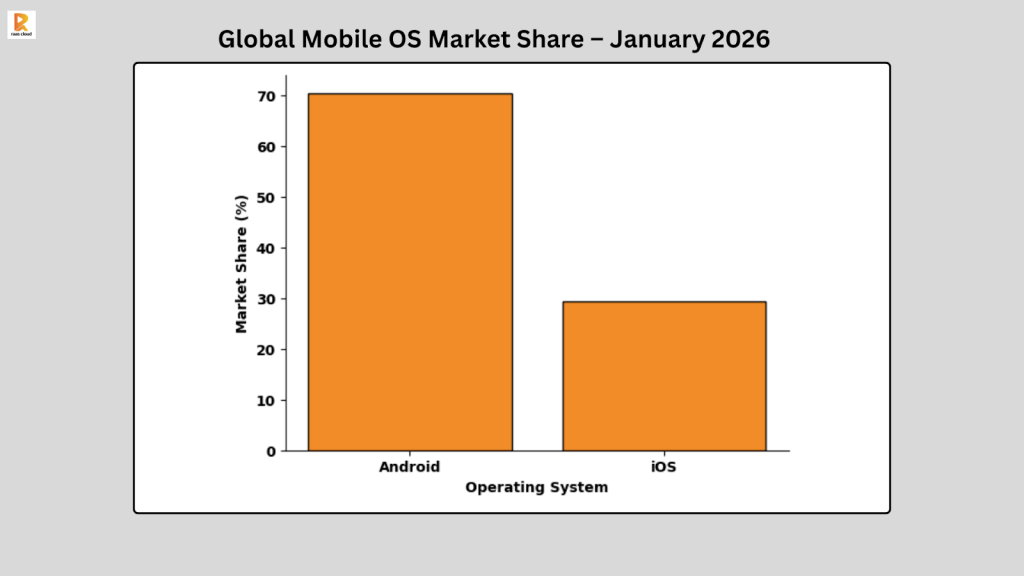
Android powers more than two-thirds of smartphones worldwide. iOS maintains close to one-third of the market, showing a strong presence despite fewer device options. Other operating systems together account for less than 1%, making this a two-player market globally.
2. Android Captured 79% of Worldwide Smartphone Sales in Q3 2025 While iPhone Secured 17% of Quarterly Global Sales
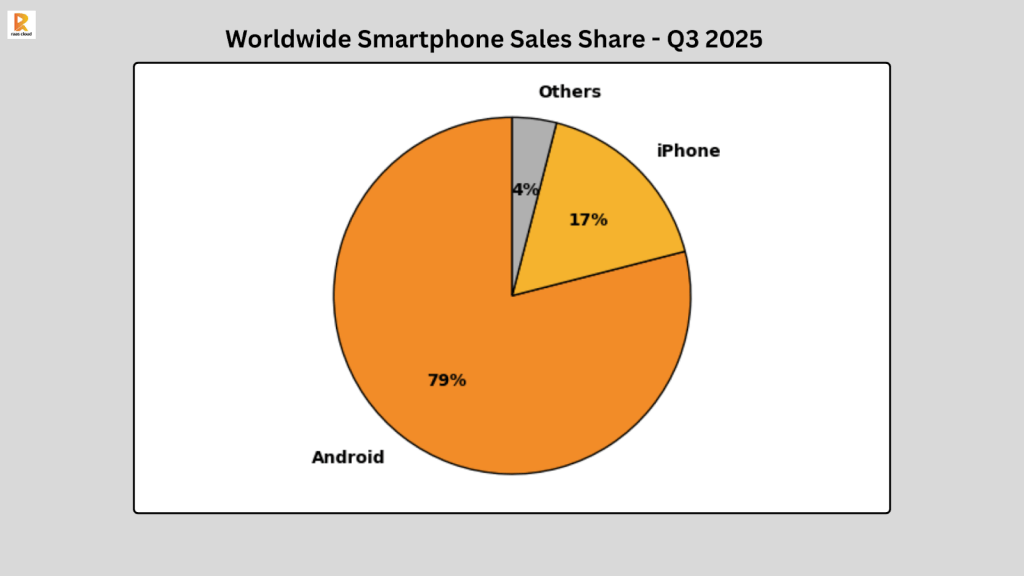
This gap shows Android’s dominance in volume driven markets, especially where affordability matters. iPhone, despite lower unit sales, continues to focus on the premium segment, where higher pricing and brand loyalty support its market position in developed economies.
3. Android Has Between 3.9 and 4.5 Billion Active Users Globally Compared to 1.46 to 1.8 Billion iOS Users
The large user base gives Android a wider global reach, especially in emerging markets. iOS, while smaller in total users, still represents a massive and highly engaged audience worldwide.
How Does iPhone vs Android Market Share Differ by Country?
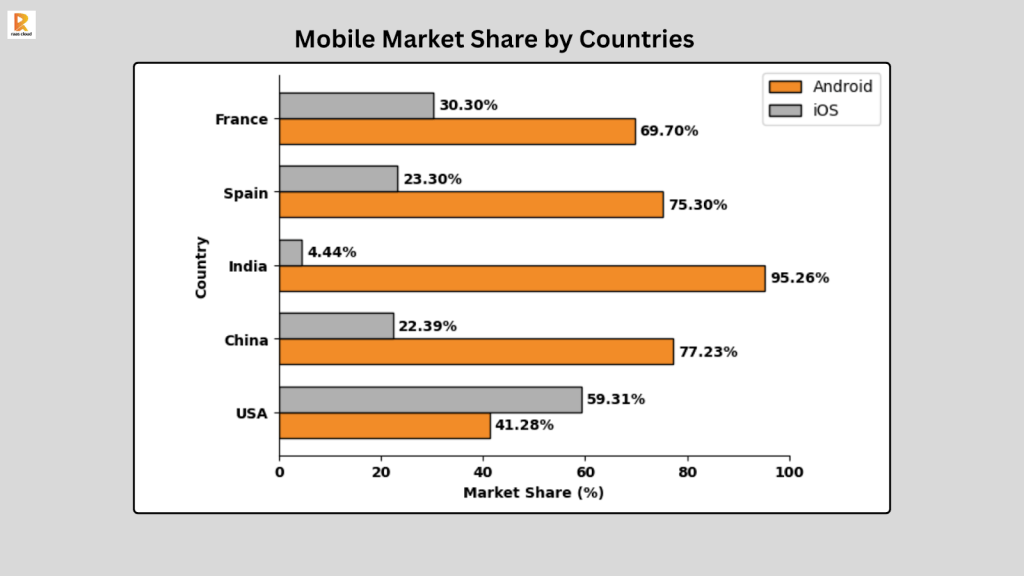
4. India Shows the Highest Android Market Share at 95.26% While the United States Records the Highest iOS Share at 59.31%
Market Share by Country:
| Country | Android | iOS |
| USA | 41.28% | 59.31% |
| China | 77.23% | 22.39% |
| India | 95.26% | 4.44% |
| Spain | 75.3% | 23.3% |
| France | 69.7% | 30.3% |
India and the United States show two very different smartphone patterns.
India has a 95.26% Android share because the market is highly price sensitive. Many users prefer affordable devices. Android brands offer phones across low and mid price ranges, which makes them accessible to a large population.
In contrast, the United States records a 59.31% iOS share. The US market has higher average income levels and strong brand loyalty toward Apple. Many users choose premium devices, which helps iOS lead in that region.
5. The United States Had Approximately 100 Million Android Users in 2025
Even though iOS leads in the US share, Android still serves a very large audience, confirming that both platforms remain important in the American market.
How has the iPhone vs Android Market Share Changed Over Time?
6. Android grew from 2.41% Market Share in 2009 to 72.77% by 2025 While iOS Stabilized Between 26% and 29% After Starting at 34.01% in 2009
Worldwide Market Share Trend (2009–2025):
| Year | iOS | Android |
| 2009 | 34.01% | 2.41% |
| 2010 | 25.48% | 8.82% |
| 2011 | 22.29% | 19% |
| 2012 | 24.04% | 27.41% |
| 2013 | 24.03% | 39.21% |
| 2014 | 23.95% | 53.65% |
| 2015 | 20.2% | 64.2% |
| 2016 | 19.29% | 69.11% |
| 2017 | 19.65% | 72.63% |
| 2018 | 20.47% | 75.45% |
| 2019 | 22.71% | 75.47% |
| 2020 | 26.28% | 73.06% |
| 2021 | 27.34% | 71.89% |
| 2022 | 27.85% | 71.47% |
| 2023 | 29.02% | 70.26% |
| 2024 | 27.81% | 71.56% |
| 2025 | 26.82% | 72.77% |
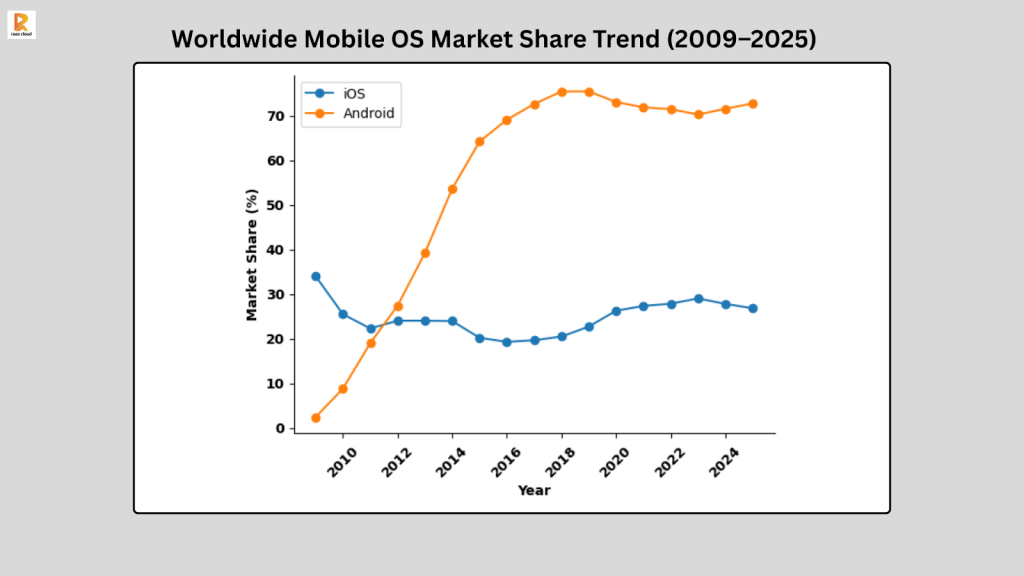
Android’s rapid growth happened between 2011 and 2015, when its share crossed 50% and became the global leader. Since then, Android has remained above 70% worldwide. iOS declined from its early peak but has stayed stable around the mid to high 20% range, supported by strong loyalty in premium markets.
How Do iPhone and Android Compare in App Revenue and Spending?
7. iOS Generates Over 65% of Global App Revenue Even Though Android Serves More Than 70% of Worldwide Users
iPhone users contribute a larger share of app spending compared to Android users. Even with a smaller global user base, iOS leads in revenue generation with stronger monetization per user on the Apple ecosystem.
8. App Store Revenue Is Projected to Grow from 85 Billion Dollars in 2021 to 161 Billion Dollars by 2026 While Google Play Revenue Is Expected to Increase from 47 Billion Dollars to 72 Billion Dollars
App Store vs Google Play Consumer Spending (2021–2026):
| Year | App Store (iOS) | Google Play (Android) |
| 2021 | $85B | $47B |
| 2022 | $92B | $45B |
| 2023 | $108B | $51B |
| 2024 | $124B | $58B |
| 2025 | $142B | $65B |
| 2026 | $161B | $72B |
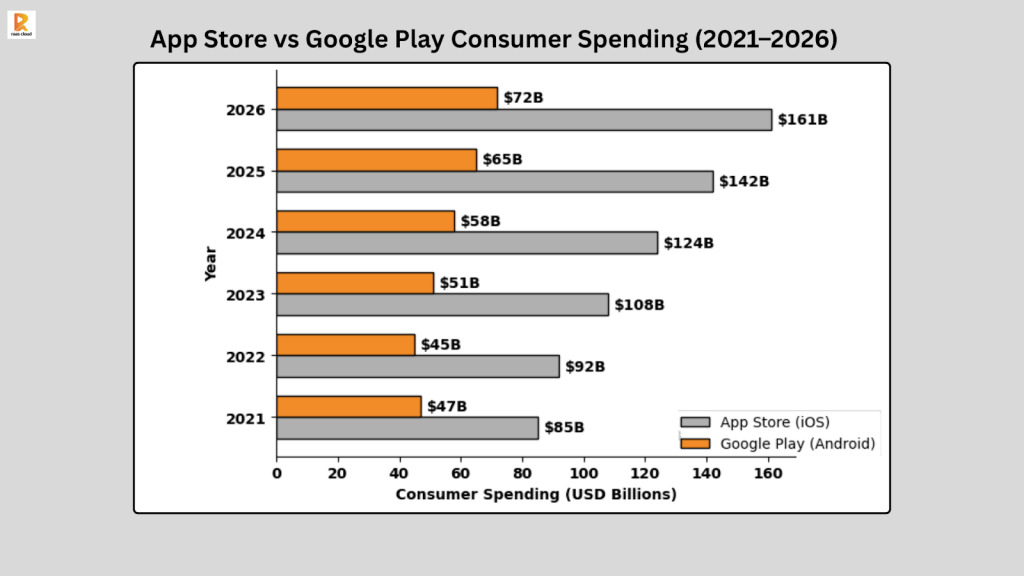
The data shows consistent year-on-year growth for both platforms. However, the revenue gap remains wide. iOS continues to generate nearly double the consumer spending compared to Android.
How Do iPhone and Android Users Differ in Spending and Usage Behaviour?
9. iPhone Users Spend an Average of 101 Dollars Per Month on Technology Which Is Nearly Double the Spending of Android Users
A clear difference in purchasing behaviour between the two platforms. iOS users tend to spend more on apps, subscriptions, and digital services compared to Android users.
10. iPhone Users Spend Around Five Hours Per Day on Their Phones While Android Users Spend About 3.7 Hours Daily
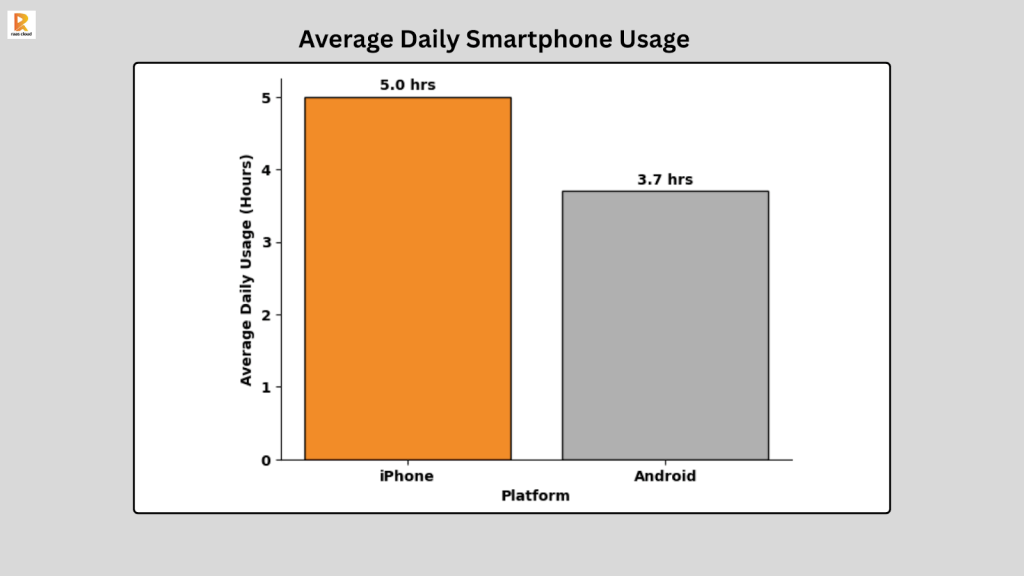
Higher daily usage suggests stronger engagement among iOS users, which can influence app interaction time, in-app purchases, and subscription usage.
11. Around 78% of Mobile Gamers Worldwide Use Android Devices
Android’s large global user base and availability of budget-friendly devices drive its dominance in mobile gaming volume. This gives Android a scale advantage in gaming distribution.
How Do iPhone and Android Users Differ by Gender and Age?
12. 60% of Men and 54% of Women Use Android While iPhone Ownership Stands at 31% for Women and 28% for Men
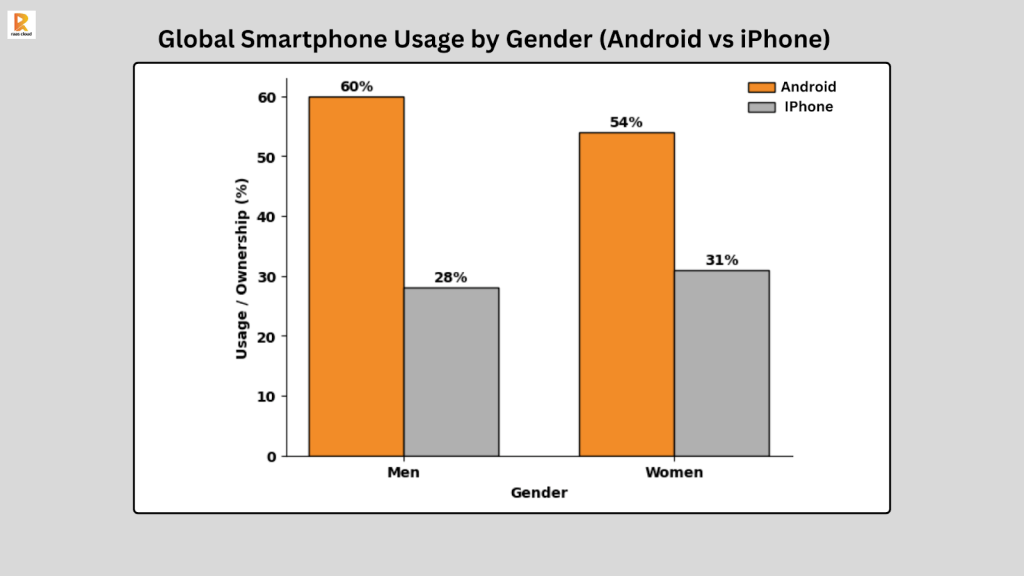
Android shows broad adoption across both men and women worldwide. At the same time, iPhone ownership is slightly higher among women than men. This means Android leads in overall reach across genders, while iOS has a small edge within the female audience.
13. 68% of U.S. Adults Aged 18 to 29 Use iPhone While the 25 to 34 Age Group Represents 27% of Global iPhone Users
Global iPhone Users by Age Group:
| Age Group | Share of iPhone Users |
| 25–34 | 27% |
| 35–44 | 23% |
| 18–24 | 22% |
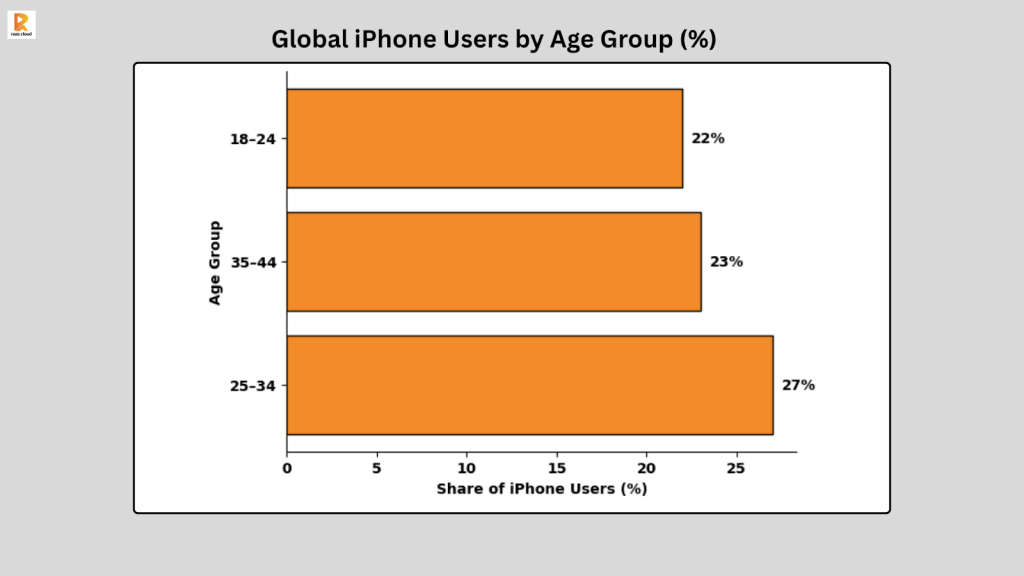
In the United States, iPhone dominates among young adults, with 68% of people aged 18–29 using iOS devices. On a global level, the 25–34 age group represents the largest share of iPhone users. The data confirms that iPhone usage is concentrated in young and early middle age consumers worldwide. These age groups often drive app downloads, subscriptions, and digital spending.
How Do Income Levels and Brand Loyalty Differ Between iPhone and Android Users?
14. iPhone Users Are More Likely to Earn Above 75,000 Dollars Annually and Are 48% More Likely to Earn Over 125,000 Dollars Compared to Android Users
The income distribution between the two user groups is noticeably different. iOS users are more concentrated in higher earning brackets, which aligns with their stronger spending patterns on apps, subscriptions, and digital services.
15. Over 90% of iPhone Users Upgrade to Another iPhone While Android Brand Loyalty Ranges Between 70% and 80%
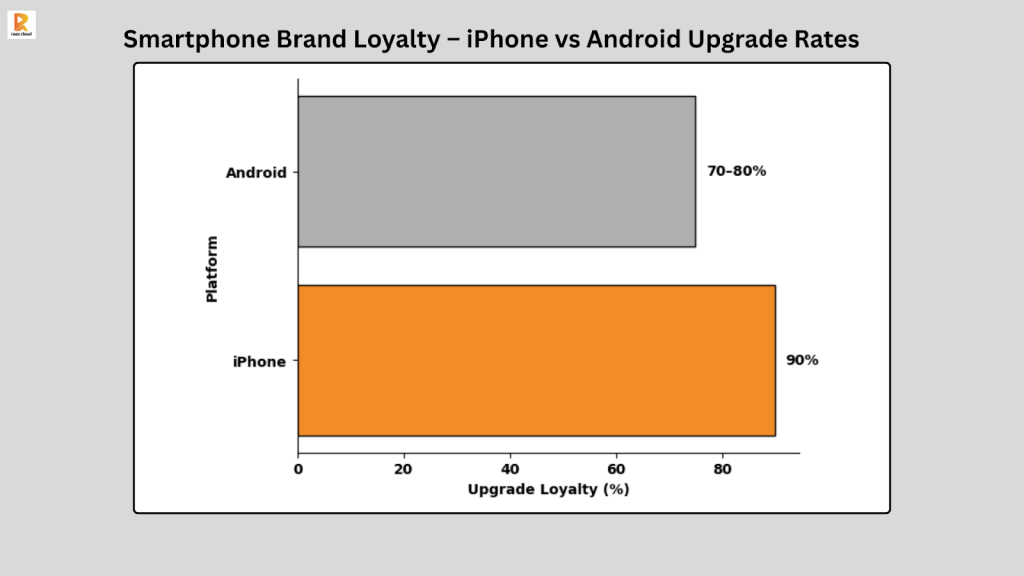
iPhone shows stronger brand retention. Android loyalty varies by brand and region, but overall retention remains lower compared to iOS.
16. 29% of iPhone Users Keep Their Devices for Three Years or Longer Compared to 21% of Android Users
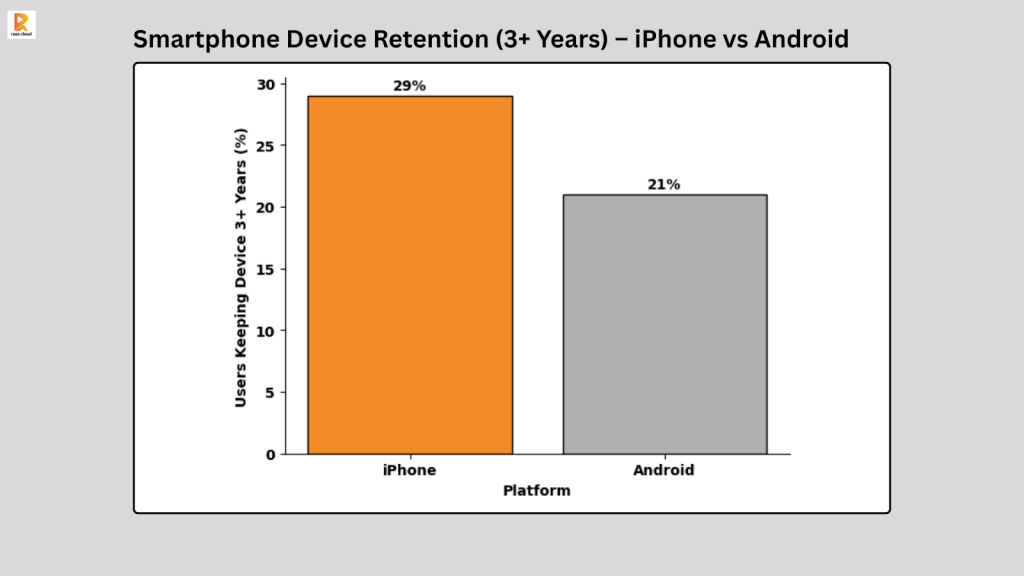
iPhone users tend to hold their devices longer. This suggests stronger hardware durability perception and ecosystem attachment among Apple customers.
Final Words
Android leads the global smartphone market in overall share, new device sales, and total active users. It dominates in high population markets and offers wide accessibility across price segments.
iPhone, despite having a smaller global share, leads in app revenue, user spending, income concentration, and brand loyalty. Its user base shows stronger monetization and higher retention rates.
Data highlights a clear contrast. Android provides global scale and reach, while iOS delivers stronger revenue per user and deeper engagement in premium markets. Both platforms play a major role in the mobile ecosystem, and the right focus depends on business goals, target audience, and monetization strategy.
💡 Explore further statistical roundup articles:
- 🤯 50+ Surprising Mobile App Development Statistics
- 50+ Important IT Outsourcing Statistics
- 50+ Stunning Mobile App Usage Statistics to Watch
Data Sources
The statistics in this article are compiled from the following research reports and industry publications:
- https://www.counterpointresearch.com/insights/global-smartphone-os-market-share/
- https://www.prnewswire.com/news-releases/iphone-users-spend-101-every-month-on-tech-purchases-nearly-double-of-android-users-according-to-a-survey-conducted-by-slickdeals-300739582.html
- https://www.demandsage.com/iphone-vs-android-users/
- https://www.statista.com/forecasts/1406592/android-vs-ios-by-gender
- https://scoop.market.us/iphone-users-statistics/
- https://www.tekrevol.com/blogs/android-vs-ios-statistics/
- https://backlinko.com/iphone-vs-android-statistics
- https://www.demandsage.com/iphone-user-statistics/
- https://cirpapple.substack.com/p/iphone-owners-keep-phones-longer
- https://gs.statcounter.com/os-market-share/mobile/united-states-of-america/
- https://www.kantar.com/campaigns/smartphone-os-market-share
- https://market.worldpanelbynumerator.com/global/smartphone-os-market-share/
- https://sensortower.com/blog/sensor-tower-app-market-forecast-2026
- https://gs.statcounter.com/os-market-share/mobile/worldwide

Dhanalakshmi Kadirvelu is a Business Intelligence and Data Analytics expert with a strong focus on software development and data engineering. She creates efficient data models, builds interactive dashboards, and integrates analytics into software systems using Power BI, OBIEE, and SQL. Her work helps development teams use data effectively to create smarter software solutions and improve business performance.