Mobile apps are now at the center of the digital world. People spend more time on apps than on websites, and businesses depend on mobile platforms to reach users faster. The growth of the mobile app industry shows how fast technology, design, and user behavior are changing.
In this listicle roundup, we will look at key mobile app development and usage statistics that explain how the mobile app world is growing, what users expect, and what tech companies need to know before building their next app.
Who We Are?
RAAS Cloud is a leading software development and IT outsourcing company delivering end-to-end digital solutions for growing businesses. Our expertise includes website development, mobile app development, eCommerce development, CMS development, and custom software built to match your specific business needs.
We provide pre-vetted tech experts across 50+ technologies through flexible engagement models. You can choose to outsource your project end to end or build a dedicated offshore team aligned with your goals, timelines, and budget.
Key Mobile App Development Statistics for 2026
Here are the most important figures that highlight the growth and direction of the mobile app industry in 2026:
- The global mobile app market is valued between $750–$800 billion in 2025 and is projected to reach $1.1 trillion by 2034.
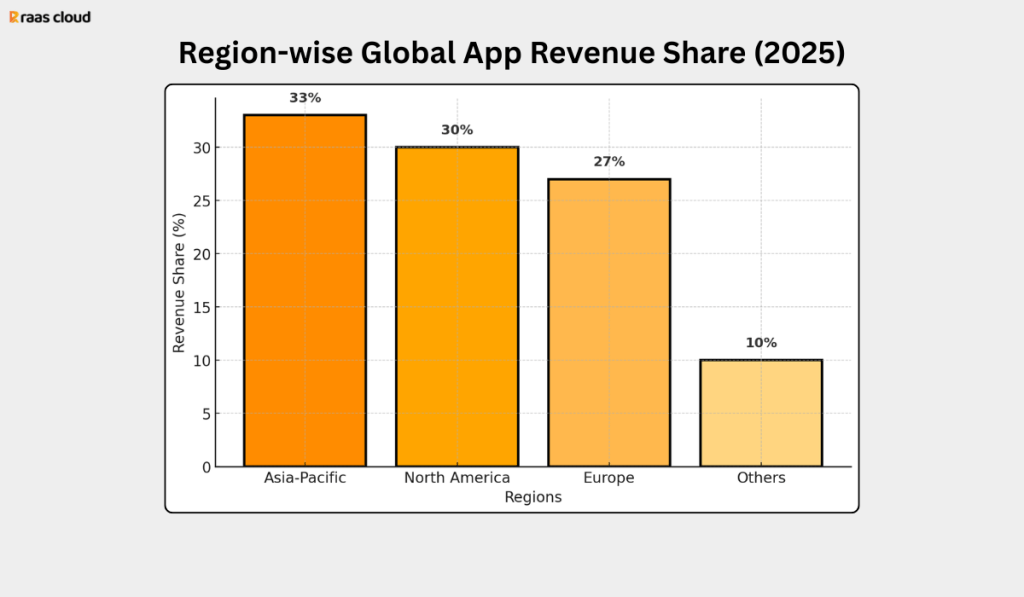
- Asia-Pacific leads with 33% of total app revenue, followed by North America (30%) and Europe (27%).
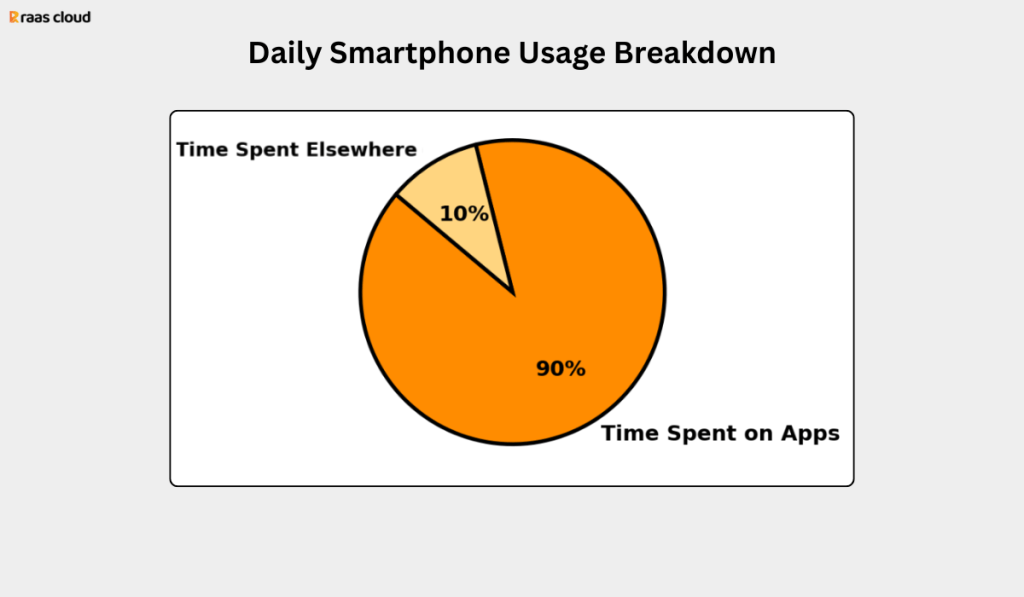
- The average smartphone user spends 4.6 hours daily on their phone, with 90% of that time inside apps.
- Users spent over 4.2 trillion hours using mobile apps in 2024 — a record level of engagement.
- Around 998 new apps are added to Google Play each day, and 46,000 new apps were launched in April 2025 alone.
- 35 million professional mobile app developers are active worldwide, up from 28 million in 2024.
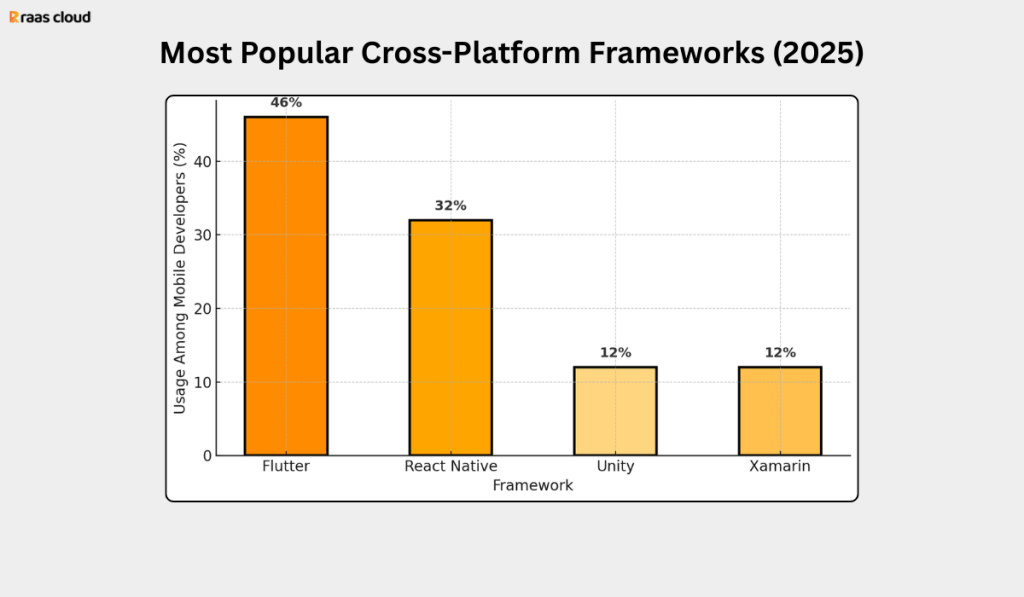
- Flutter is the most popular cross-platform framework, used by 46% of developers, followed by React Native (32%).
- Advertising generates about 60–65% of all app revenue, while in-app purchases make up 33–43%.
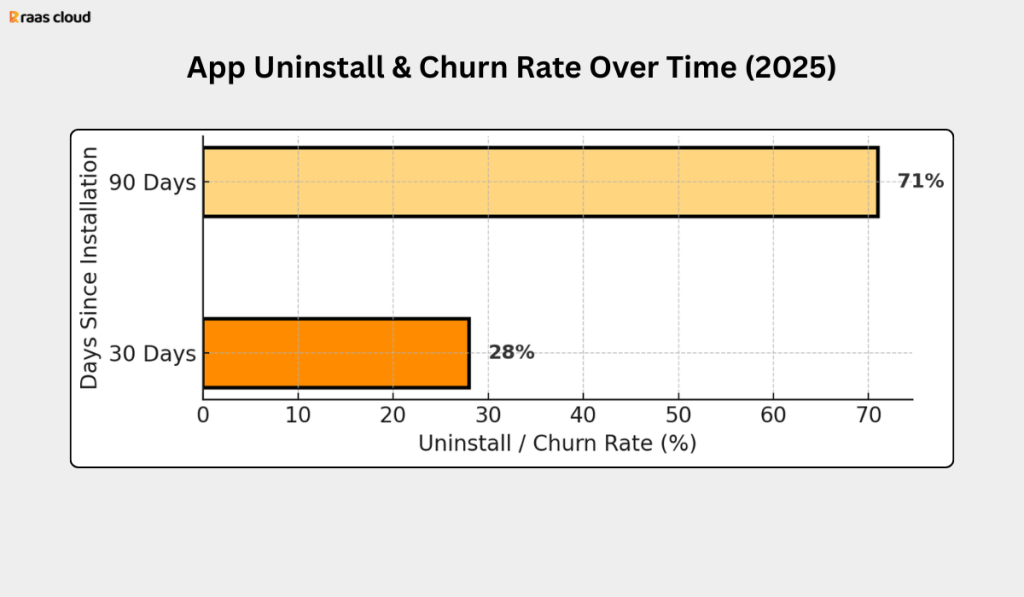
- 25% of apps are used only once after installation, and 28% are uninstalled within 30 days.
- Sending three push notifications per week can boost retention by up to 190%.
- About 65% of global enterprises now use Mobile Backend-as-a-Service (BaaS) platforms for faster development.
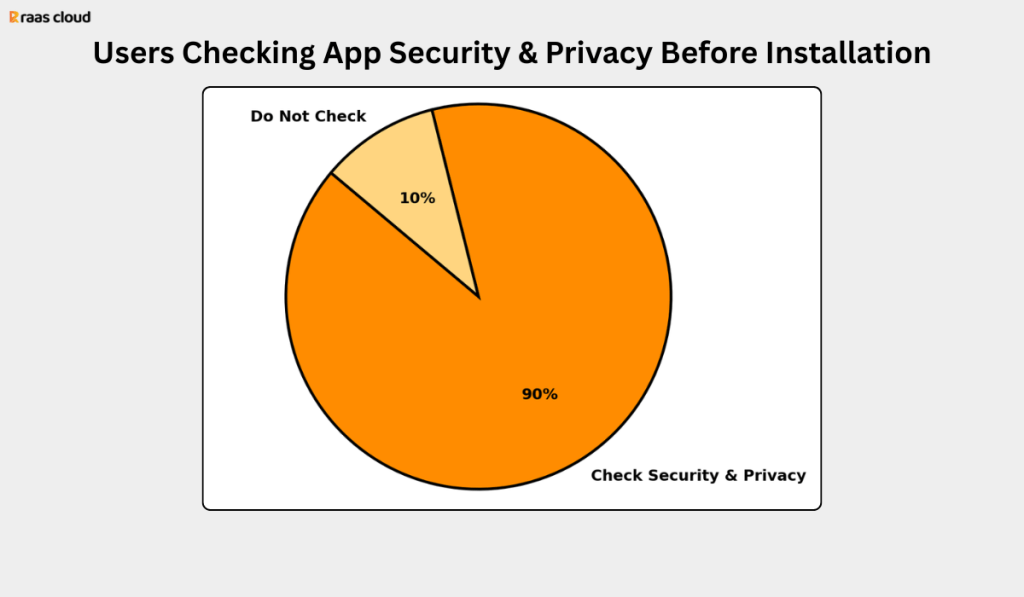
- 90% of users review security and privacy details before downloading a new app.
Mobile App Industry Market, Growth Rate, and Regional Leaders
The global mobile app industry is expanding at a record pace. With billions of smartphone users and strong spending across regions, mobile applications have become one of the most profitable areas in technology. These statistics show why more companies are investing in app development and how the global market is shaping the future of digital business.
- The global mobile app market is expected to reach between $750 billion and $800 billion by 2027, showing how fast mobile platforms are becoming a key business channel.
- The mobile app market is expected to grow at a 21.55% yearly rate, reaching $1.1 trillion by 2034.
- Region-wise, Asia-Pacific leads with 33% of global app revenue, followed by North America with 30% and Europe with 27%, showing strong worldwide demand.
- Another interesting statistic shows that about 79% of app downloads and spending happen outside the developer’s home country, proving that mobile apps have a truly global user base.
Smartphone Usage and App Download Trends Worldwide
People depend on their smartphones more than ever before. The constant increase in mobile use has made apps an essential part of daily life and business communication. These statistics show how users interact with their devices and how this behavior creates endless opportunities for mobile app developers.
- On average, people check their phones about 58 times a day, while Americans check 144 times daily, showing how deeply phones are part of modern life.
- The average smartphone user spends about 4 hours and 39 minutes daily on their phone, and nearly 90% of that time is spent inside apps.
- In 2024, users spent over 4.2 trillion hours using mobile apps, which shows how apps dominate total screen time.
- The Google Play Store recorded around 998 new apps added each day, while April 2025 alone saw 46,000 new app launches, showing the constant growth of new mobile products.
- In 2024, there were 136 billion unique app downloads worldwide, marking one of the highest download counts in history.
- Most apps are free, with 97% of Google Play apps and 95% of Apple App Store apps available at no cost, proving that free access is key to reaching large audiences.

Enterprise Mobile App Statistics for 2026
Enterprises now depend on mobile apps to manage teams, data, and daily operations. Companies use internal apps, field tools, and cloud platforms to improve speed and access across departments. These statistics explain how enterprise mobile apps grow and where businesses invest the most.
- The enterprise mobile application development market is valued at USD 189.22 billion in 2026, up from USD 168.45 billion in 2025, showing steady demand from large organizations.
- The market is projected to reach USD 338.42 billion by 2031, growing at a 12.33% annual rate, driven by cloud adoption and mobile-first workflows.

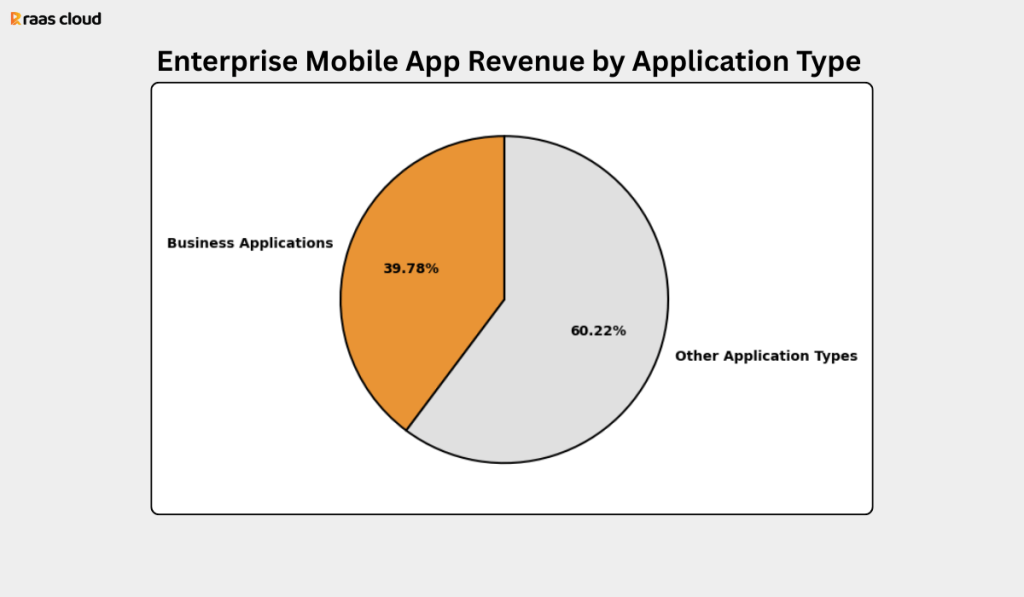
- Business applications led enterprise mobile app revenue in 2025 with a 39.78% market share, driven by internal workflow and communication needs.
- Field service applications show the fastest growth at a 15.02% yearly rate, as utilities and telecom companies equip remote teams with mobile tools.
- Cloud-based enterprise mobile apps led the market in 2025 with a 67.92% revenue share and continue to grow at a 14.12% annual rate as enterprises adopt scalable and remote-ready systems.
- Large enterprises accounted for 63.65% of the total market share in 2025, reflecting higher mobile app budgets and wider deployment.
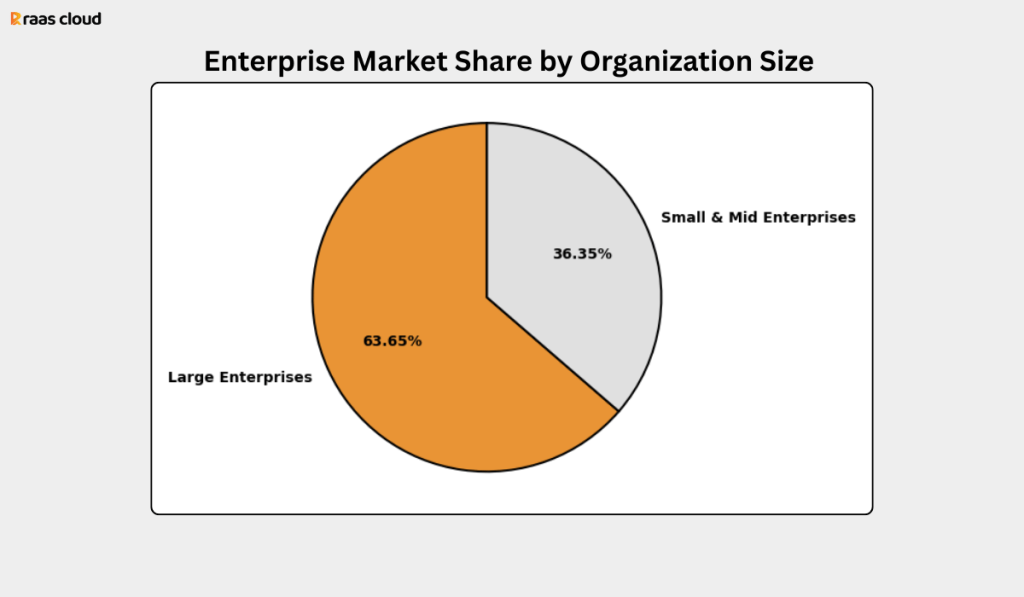
- Small and medium enterprises grow faster, posting a 15.29% yearly growth rate as mobile platforms become easier to adopt.
- By industry, IT and telecom companies held 28.22% of the market in 2025, making them the largest enterprise users of mobile apps.
- Retail and e-commerce enterprise apps grow at a 14.35% annual rate, driven by mobile sales, inventory, and workforce tools.
- North America remained the largest enterprise mobile app market with a 37.95% revenue share in 2025, supported by strong cloud usage and early 5G adoption.
- Asia-Pacific shows the fastest regional growth with a 14.88% yearly growth rate, led by enterprise digital transformation.
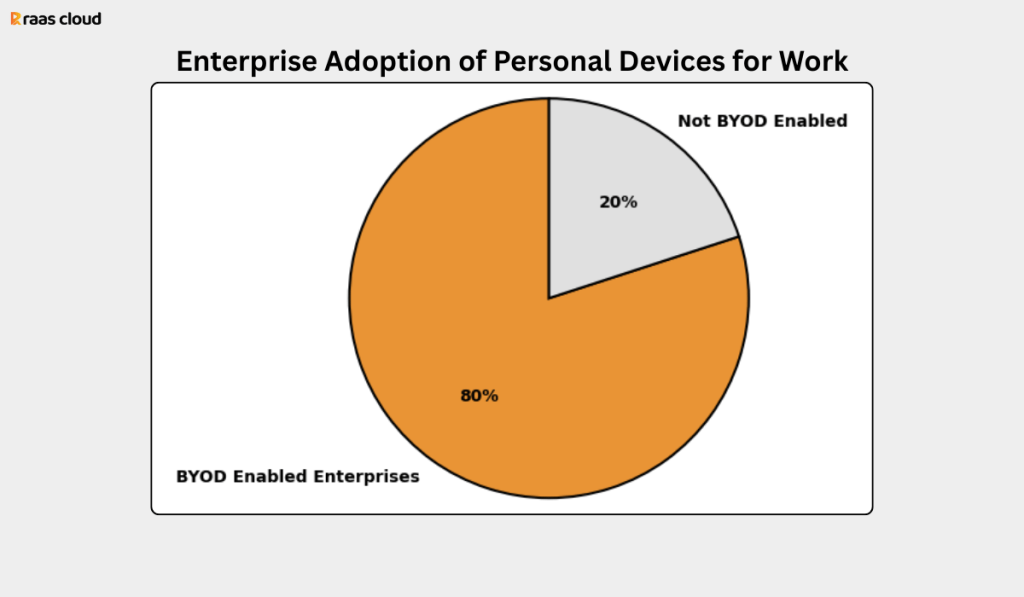
- More than 80% of enterprises now allow employees to use personal smartphones and tablets for work, increasing demand for secure internal mobile apps.
- Enterprise cloud platforms continue to benefit from mobile workloads. In Q2 2025, Microsoft Azure reported 31% year-over-year growth, with enterprise mobile apps listed as a key driver.
How Users Interact with Mobile Apps — Retention, Churn, and Loyalty Stats
Building an app is only the first step — keeping users active is the real challenge. Many users stop using an app soon after downloading it, which shows how important design, performance, and user experience are for long-term success. These statistics explain how users engage with apps and what causes them to leave or stay.
- The average smartphone has over 80 installed apps, but 62% of them go unused each month, showing how few apps make it into users’ daily routines.
- People actively use around 9 apps per day and 30 per month, meaning users focus only on apps that add clear value.
- 25% of apps are used just once after download and never opened again, highlighting how first impressions decide user loyalty.
- Around 28% of users uninstall an app within the first 30 days, while the churn rate climbs to 71% by 90 days, which makes the first month critical for retention.
- In Japan, app users show the strongest loyalty with a 5.1% retention rate, while China records the fastest drop-off at 1.3% retention.
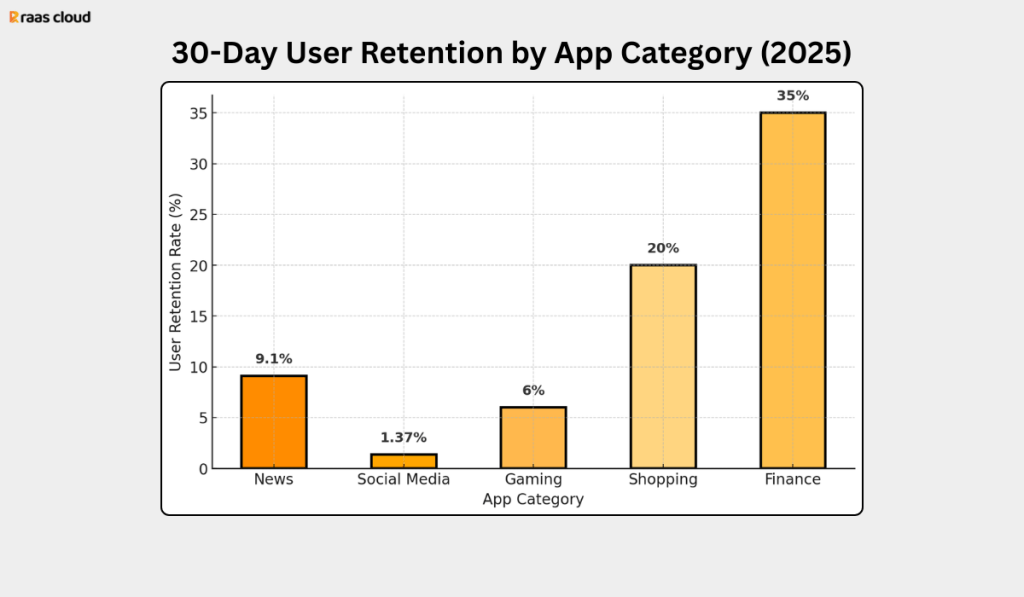
- Retention rates vary by app category — news apps keep 9.1% of users after 30 days, social media retains 1.37%, gaming apps lose 94% of players in one month, shopping apps lose 80% within a week, and finance apps retain 35% after 30 days.
- The 30-day retention rate on Android is 2.6%, while iOS apps hold 4.3%, showing iOS users stay slightly longer.
- 21% of millennials open an app 50 or more times per day, making them the most engaged mobile audience.
- Users who complete onboarding in under one minute are 50% more likely to continue using the app, which proves that simple and fast onboarding increases retention.
- Sending three push notifications per week can boost user retention by up to 190%, showing the power of consistent communication.
The Global Mobile App Developer Landscape
The global developer community is growing fast, showing how strong and active the mobile app development industry has become. Companies can now access a wider pool of skilled professionals to build reliable and high-performing apps for every platform.
- There are over 35 million professional mobile app developers worldwide, growing from 2.5 million in 2010 and 28 million in 2024, showing a steady increase in global talent.
- About 40% of all software developers now work in mobile app development, making it one of the most in-demand tech fields.
- The developer community is globally spread — Asia contributes 36%, Europe 29%, North America 20%, Latin America 7%, Africa 5%, and Oceania 3%, showing balanced talent growth across regions.
- The global smartphone penetration rate grew from 4.6% in 2010 to nearly 80% in 2024, which directly increased the demand for mobile app developers and new digital products.
👉 Explore software development statistics
Mobile Tech Stack and Framework Trends
Choosing the right technology is one of the most important parts of mobile app development. These statistics highlight the most used languages and frameworks that developers rely on to build scalable and high-quality apps.
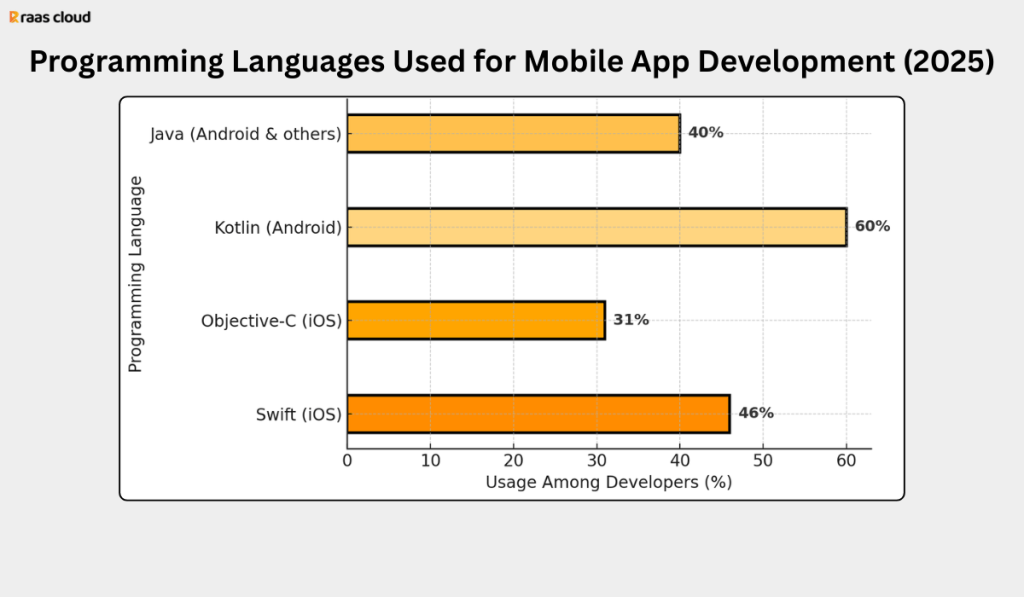
- For iOS apps, 46% of developers use Swift, while 31% still use Objective-C, mainly to manage or update older apps.
- For Android apps, over 60% of professional developers use Kotlin, which is Google’s official language for Android.
- Developers follow different approaches — Hybrid frameworks make up 40.8%, Native apps 31.7%, and Web-based apps 27.5%, based on project goals and user needs.
- Flutter, powered by Dart, is used by 46% of mobile developers, making it the most popular cross-platform framework. React Native is used by 32%, while Unity and Xamarin hold around 12% each.
- On app stores, 79% of iOS apps are written in Swift, and 77% of Android apps use Kotlin, and 20% use Jetpack Compose, proving that both ecosystems now rely heavily on modern development languages.
Performance and Usability Factors That Impact App Retention
Strong performance and a smooth user experience are the backbone of every successful mobile app. Even the most creative idea can fail if an app runs slowly, crashes often, or confuses users. These statistics show how performance, usability, and maintenance directly affect app success.
- 73% of users stop using an app because of poor visuals, confusing layouts, or broken navigation buttons. This proves that design and performance must work together.
- Around 1 in 5 users expect to complete key app tasks in under 5 seconds, showing how speed impacts user satisfaction.
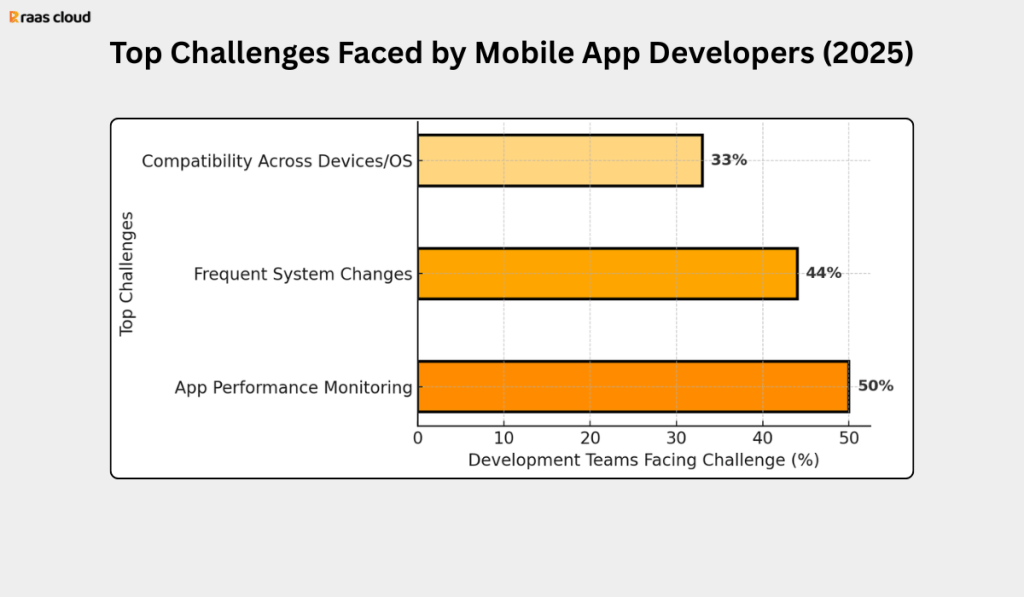
- Among development teams, 50% list app performance monitoring as their top challenge, while 44% struggle with frequent system changes, and 33% face issues maintaining compatibility across multiple devices and operating systems.
- Regular updates and fixes are essential — on average, app maintenance costs about 15–20% of the original development cost per year, including bug fixes, feature improvements, and version updates.
Revenue Models and Growth Stats of Mobile Apps
How an app earns money is as important as how it performs. Businesses choose different monetization models based on their audience and app type. These statistics show how apps generate revenue and what strategies work best in today’s market.
- Advertising is the main source of app income, accounting for around 60–65% of total mobile app revenue worldwide.
- In-app purchases make up 33–43% of overall app earnings, including spending on digital goods, game credits, or premium content.
- About 35% of apps combine subscriptions with other purchase options, such as consumables or one-time unlocks, to create steady revenue streams.
- Paid app downloads account for only about 1% of total app revenue, proving that users prefer free apps with optional upgrades.
- Nearly 98% of global mobile app revenue comes from free apps, meaning that free-to-download models still dominate the market.
Which App Types Dominate Downloads and Spending
Different app categories attract different audiences, but some sectors grow faster and make more money than others. These statistics highlight which app types lead the market and how new technologies like AI and voice assistants are shaping user behavior.
- The gaming industry continues to expand and is expected to cross $150 billion in annual revenue by 2030, making it the top-earning category in mobile.
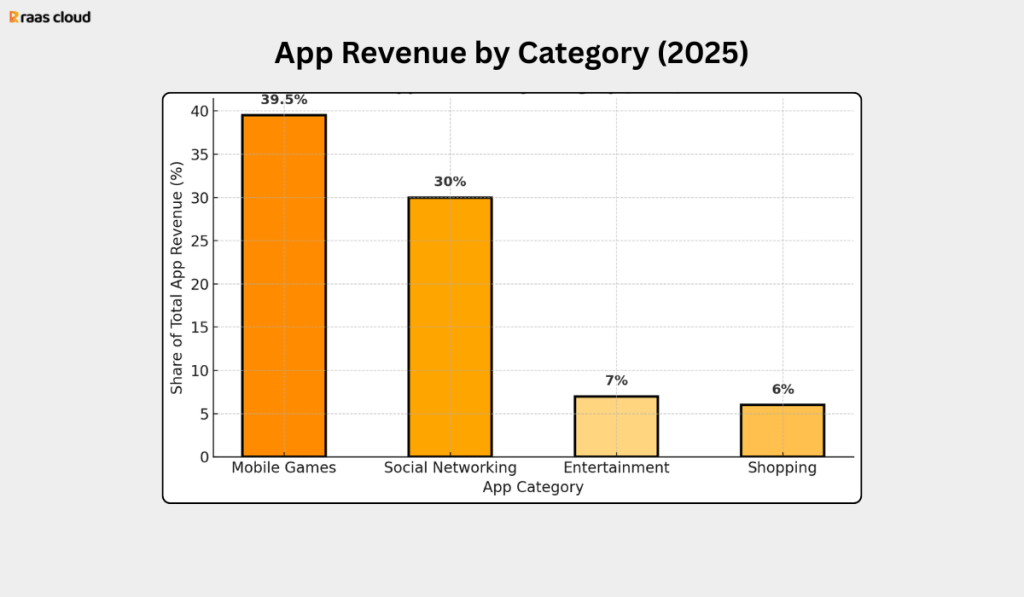
- Mobile games make up around 13–14% of all apps, yet they attract nearly 100 billion downloads every year and generate about $81 billion in revenue, accounting for 38–41% of total app store earnings.
- Social networking apps contribute 30% of total app revenue, while entertainment apps make up 7% and shopping apps contribute around 6%.
- AI chatbot apps saw downloads rise by 112% year-over-year in 2024, showing how fast artificial intelligence tools are entering the app ecosystem.
- Voice assistant apps currently hold a $6 billion market share and are expected to grow at a 30.8% yearly rate from 2025 to 2034, proving strong long-term potential for voice-driven applications.
Mobile App Security and Privacy Standards Developers Must Know
Security is one of the top priorities in mobile app development. Users expect apps to protect their personal data, and app stores have strict rules to ensure safety and privacy. These statistics show how seriously security is handled across the app industry.
- Around 90% of mobile users check security and privacy details before installing a new app, showing that trust plays a key role in app adoption.
- Nearly 17% of users refuse to use an app if it doesn’t clearly protect their personal data, which shows that strong privacy practices build confidence.
- In 2024, Google rejected 2.36 million policy-violating apps on the Play Store and banned over 158,000 developer accounts for publishing harmful software. This shows how platform-level checks help keep users safe and maintain trust in the app ecosystem.
Building Scalable Mobile Apps: Backend Systems and Integration
A strong backend system is what keeps a mobile app running smoothly. From managing data to supporting user interactions, backend technologies ensure that apps are fast, reliable, and secure. For businesses, scalable backend solutions are key to handling growth and complex operations.
- Around 65% of global enterprises use Mobile Backend-as-a-Service (BaaS) platforms to support their mobile app development and integrate with existing systems.
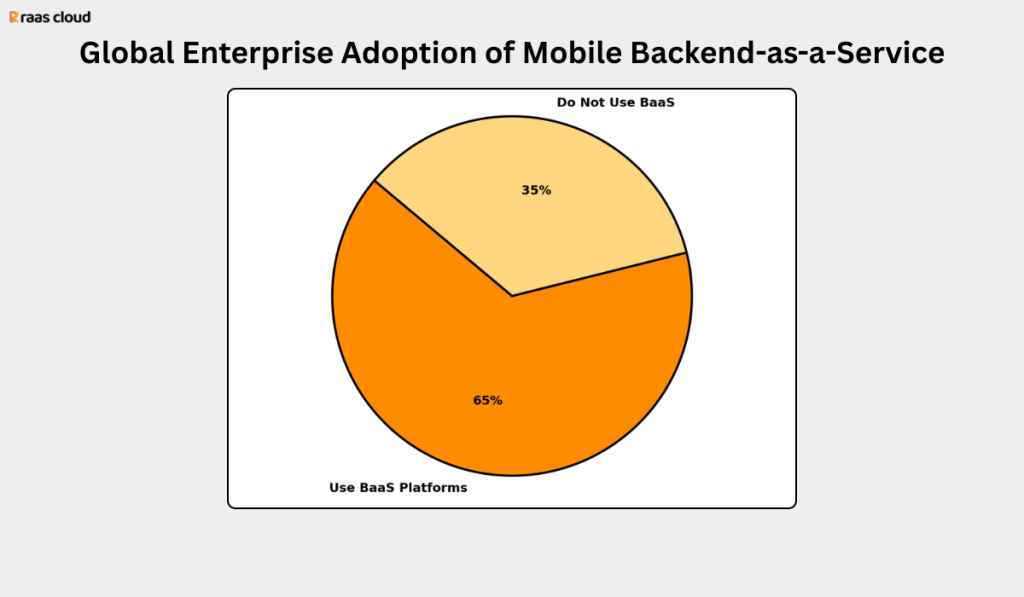
- The BaaS market is expected to grow at a 45.7% yearly rate from 2025 to 2033, driven by the need for faster development, better scalability, and easier data management.
- These platforms allow companies to focus more on app features and user experience while reducing the time and cost needed to build and maintain backend infrastructure.
The Future of Mobile Apps: AI, AR/VR, and Voice Assistants
The future of mobile app development is closely tied to new technologies like artificial intelligence, augmented reality, and virtual assistants. These innovations are changing how apps are built and how users interact with them. Developers and businesses that adopt these technologies early will have a strong advantage in the years ahead.
- Around 79% of developers believe that AI and machine learning will strongly influence how apps are built in the next five years, shaping everything from design to automation.
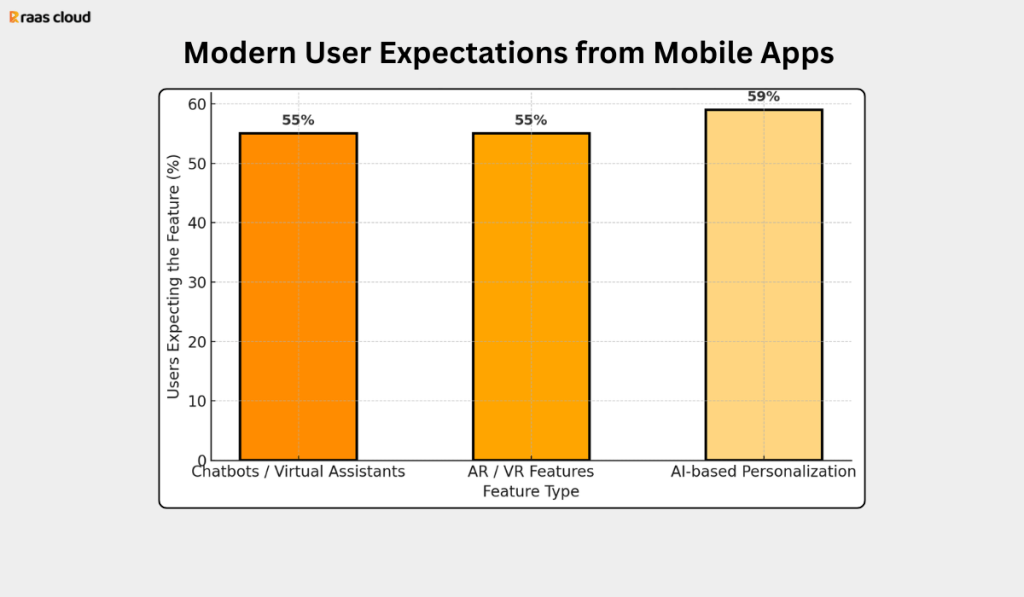
- Modern users also expect more advanced experiences — 55% want apps with chatbots or virtual assistants, 55% look for augmented or virtual reality features, and 59% expect AI-based personalization in their apps.
- Voice assistant apps are becoming one of the fastest-growing segments, expected to rise from $6 billion in 2024 to $87.5 billion by 2034, at an impressive 30.8% yearly growth rate.
- According to Gartner, mobile app usage could drop by 25% by 2027 as AI assistants begin to replace many app functions and companies consolidate apps to lower costs.
Final Words: What These App Statistics Mean for Businesses
The mobile app development industry is growing every year, driven by new technology, higher user demand, and better global connectivity. The market value is rising, and the developer ecosystem is also expanding, which shows that mobile apps will continue to play a major role in how businesses build digital products.
For businesses, this growth creates clear opportunities. Companies can reach global users, add AI-driven features, and improve app speed, security, and user experience. With the right tech stack and an experienced development partner, it is easier to build reliable and scalable mobile apps.
As mobile phones continue to shape how people work and live, investing in a quality mobile app is now a business need, not a choice. If you are looking for a mobile app development company, get in touch with RAAS Cloud. We build both iOS and Android apps for startups, SMEs, and enterprise businesses.
Data Sources
- https://www.reviews.org/mobile/cell-phone-addiction/
- https://www.statista.com/statistics/271644/worldwide-free-and-paid-mobile-app-store-downloads/
- https://techreport.com/statistics/mobile-internet-traffic-statistics/
- https://techjury.net/blog/app-usage-statistics/
- http://statista.com/statistics/263797/number-of-applications-for-mobile-phones/
- https://www.statista.com/topics/1002/mobile-app-usage/
- https://xhumanlabs.com/2025/02/17/top-mobile-app-development-stats-2023/
- https://www.itransition.com/services/application/development/mobile/statistics
- https://sensortower.com/blog/2025-state-of-mobile-consumers-usd150-billion-spent-on-mobile-highlights
- https://www.blog.udonis.co/mobile-marketing/mobile-apps/mobile-app-market-forecast
- https://sensortower.com/state-of-mobile-2025
- https://www.statista.com/outlook/amo/app/worldwide
- https://www.businessofapps.com/app-developers/research/app-development-trends/
- https://www.statista.com/statistics/793628/worldwide-developer-survey-most-used-languages/
- https://security.googleblog.com/2025/01/how-we-kept-google-play-android-app-ecosystem-safe-2024.html.
- https://www.statista.com/statistics/1020956/android-app-releases-worldwide/
- https://www.marketgrowthreports.com/market-reports/mobile-backend-as-a-service-baas-market-100027
- https://appfigures.com/top-sdks/development/apps
- https://developer.android.com/kotlin
- https://48066860.fs1.hubspotusercontent-na1.net/hubfs/48066860/PDFs/EB-state-of-mobile-experience-2023.pdf
- https://www.instabug.com/mobile-user-expectations-2025
- https://aso.apptweak.com/aso-trends-benchmarks-a-comprehensive-data-study
- https://www.appdome.com/wp-content/uploads/2024/06/Appdome-Mobile-Consumer-Survey-2024.pdf
- https://www.ibm.com/thought-leadership/institute-business-value/report/ai-retail.
- https://market.us/report/voice-activated-apps-market/
- https://www.gartner.com/en/newsroom/press-releases/2025-01-15-gartner-predicts-mobile-app-usage-will-decrease-25-percent-due-to-ai-assistants-by-2027.
- https://mindsea.com/app-stats/
- https://explodingtopics.com/blog/smartphone-usage-stats
- https://vwo.com/blog/10-reasons-mobile-apps-are-better/
- https://www.ailoitte.com/blog/how-to-reduce-app-uninstall-rate/
- https://simpletexting.com/blog/screen-time-survey/
- https://tsttechnology.io/blog/mobile-app-development-statistics
- https://www.mordorintelligence.com/industry-reports/enterprise-mobile-application-development-market
FAQs
1. What is the global market size of mobile app development in 2026?
In 2026, the global mobile app development market, covering the development, monetization, and deployment of mobile applications, is estimated to be worth around USD 378 billion. The Asia-Pacific region dominates, holding over 33% to 52% of the market share, driven by rapid digital transformation in China, India, and Japan.
2. How fast is the mobile app industry growing?
The mobile app industry is growing at a 21.55% annual rate, fueled by increasing user engagement, cloud-based tools, and cross-platform frameworks. This rapid growth reflects the global shift toward mobile-first experiences for shopping, gaming, communication, and enterprise solutions.
3. Which regions lead in mobile app revenue?
Asia-Pacific leads the mobile app market with 33% of global revenue, followed by North America (30%) and Europe (27%). Strong smartphone adoption, local app ecosystems, and digital payments make Asia the fastest-growing hub for app downloads and monetization.
4. What are the top technologies used in mobile app development?
Developers mostly use Swift and Kotlin for native app development, while Flutter and React Native dominate cross-platform builds. Hybrid frameworks now power over 40% of all apps, offering faster development, easier updates, and better performance across iOS and Android devices.
5. How much time do users spend on mobile apps daily?
The average smartphone user spends around 4.6 hours per day on their phone, with 90% of that time inside apps. This shows that mobile apps now dominate screen time, making user-friendly design and high performance essential for long-term retention.
6. What is the average retention rate for mobile apps?
Only 38% of users return after the first week, and retention drops to 4% by day 30 for many apps. Simple onboarding, fast performance, and personalized push notifications can improve user retention by over 190%, especially for iOS users.
7. What are the top app categories in 2026?
In 2026, the fastest-growing app categories are AI-powered productivity tools, health and fitness apps, fintech and digital payments, eLearning platforms, and on-demand service apps. Users are actively adopting apps that save time, automate routine work, and offer personalized experiences across work, finance, and daily life.
Other high-demand categories include eCommerce and quick commerce apps, logistics and delivery platforms, travel and booking apps, and community-driven platforms. With rising mobile usage and better connectivity, businesses are also investing more in B2B apps for internal operations, sales, and customer support.

Dhanalakshmi Kadirvelu is a Business Intelligence and Data Analytics expert with a strong focus on software development and data engineering. She creates efficient data models, builds interactive dashboards, and integrates analytics into software systems using Power BI, OBIEE, and SQL. Her work helps development teams use data effectively to create smarter software solutions and improve business performance.